Software required – QGIS & R需下載軟體 – QGIS & R
※ Applicable versions: QGIS 3.16 or later; R 3.0.0 or later※ 適用版本:QGIS 3.16;R 3.0.0 以上
Ⅰ. INTRODUCTIONⅠ. 介紹
What is GWR?什麼是 GWR?
GWR (Geographically Weighted Regression) is a statistical method used in Geographic Information Science (GIS) to explore spatial data relationships.
GWR(Geographically Weighted Regression)地理加權迴歸,為地理資訊科學(GIS)中探討空間數據關係的統計方法。
In real life, certain phenomena may vary based on geographical location. For instance, housing prices might be influenced by specific factors of the city they are located in. Unlike traditional regression models, which assume a fixed relationship between observations regardless of spatial location, GWR takes into account the variation of model parameters with geographical position.
在現實生活中,某些現象可能因地理位置的不同而改變,例如,房價可能受所在城市的特定因素影響。相較傳統迴歸模型假設每個觀測值間的關係都是固定且不隨空間位置變化,GWR 考量到地理位置對於模型參數的變化。
Main features主要特點
- Considers geographical location考量地理位置
Each geographical location has its own regression equation, and model parameters are allowed to vary across space.
每個地理位置都有一個迴歸方程式,且允許模型參數在空間上變化。
- Weight function權重函數
Regression parameters for each location are calculated with geographical weighting: observations closer to the location have a greater influence on its parameters.
使用地理位置加權計算每個位置的迴歸參數,越近的觀測值對該位置的迴歸參數影響越大。
- Model interpretation模型解釋
Parameter maps can be generated to show how a specific parameter varies with location, aiding the explanation of spatial variability.
可產生參數的地圖,顯示某一特定參數如何隨地理位置而變化,利於解釋空間變異性。
- Higher complexity複雜度較高
It helps explore spatial variability, but whether this level of complexity is needed should be evaluated, and sufficient data must support it.
有助於探討空間變異性,需評估是否需要此複雜度,以及確保有足夠數據支持。
Plugin advantagesPlugin 優點
Users only need to install R and the Processing R Provider plugin in QGIS, then copy the program files to the specified folder. Later adjustments can be made by editing the program files directly.
使用者僅需要安裝 R,以及在 QGIS 中安裝 Processing R Provider 插件,並將相關程式文檔複製到指定路徑下即可使用;後續若需要調整,可直接更改程式文檔。
QGIS truncates field names longer than ten characters when processing data, while the parameter menu still shows the full names. This tool truncates the selected variable names the same way QGIS does, preventing mismatches between the backend data and the user’s selection.
QGIS 在處理資料時會將超過十個字元的變數名稱進行縮減,而參數選單仍顯示原本完整的變數名稱,因此本程序也會依照 QGIS 的方式縮減使用者所選的變數名稱,避免 QGIS 後端資料的變數與使用者所選不同而導致問題。
Because QGIS’s truncation depends on the order of the fields, problems may still occur if the order of the selected variables differs from the field order in the original data.
由於 QGIS 縮減名稱的方式與變數順序有關,若使用者所選的變數順序與原始資料的變數順序不同,仍可能出現問題。
Ⅱ. INSTALLATION PROCEDUREⅡ. 安裝流程
Install the GWR tool in QGIS在 QGIS 安裝 GWR 工具
Step 1
Step 2
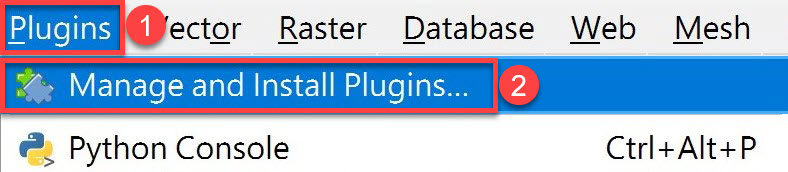
Open QGIS and click Plugins › Manage and Install Plugins… in the top menu.
開啟 QGIS 後,於上方選單點選 Plugins › Manage and Install Plugins…。
Step 3
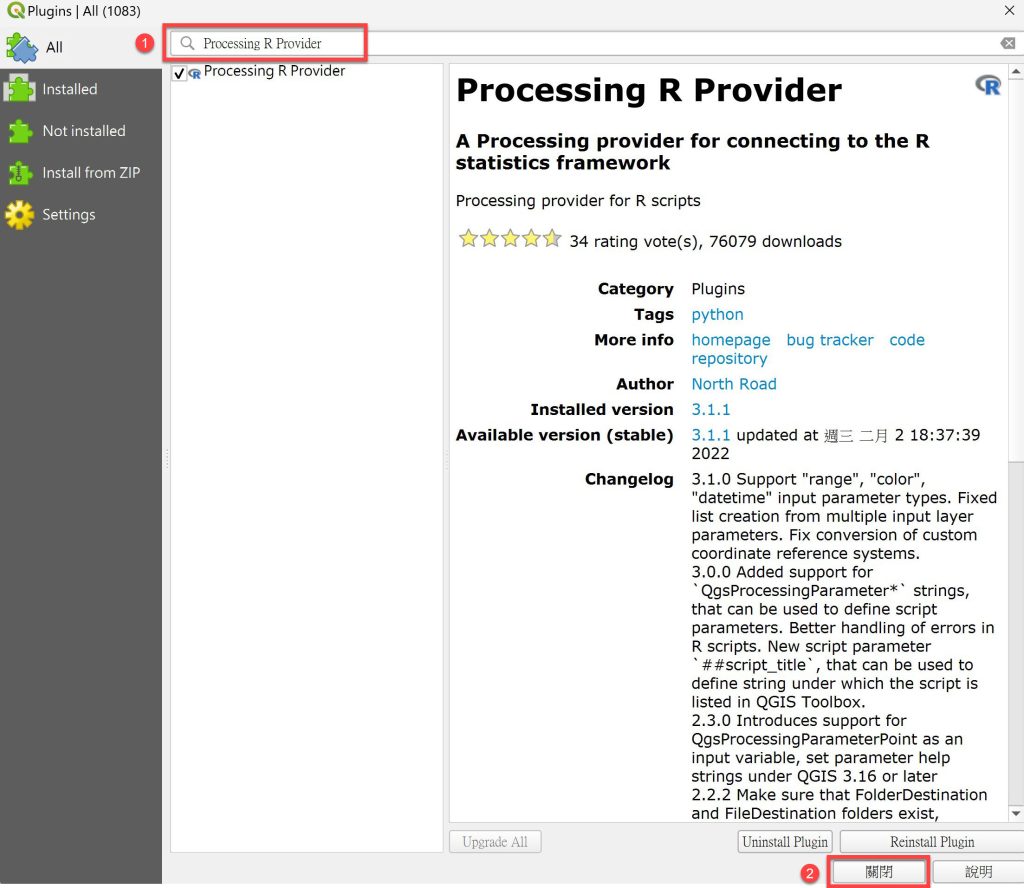
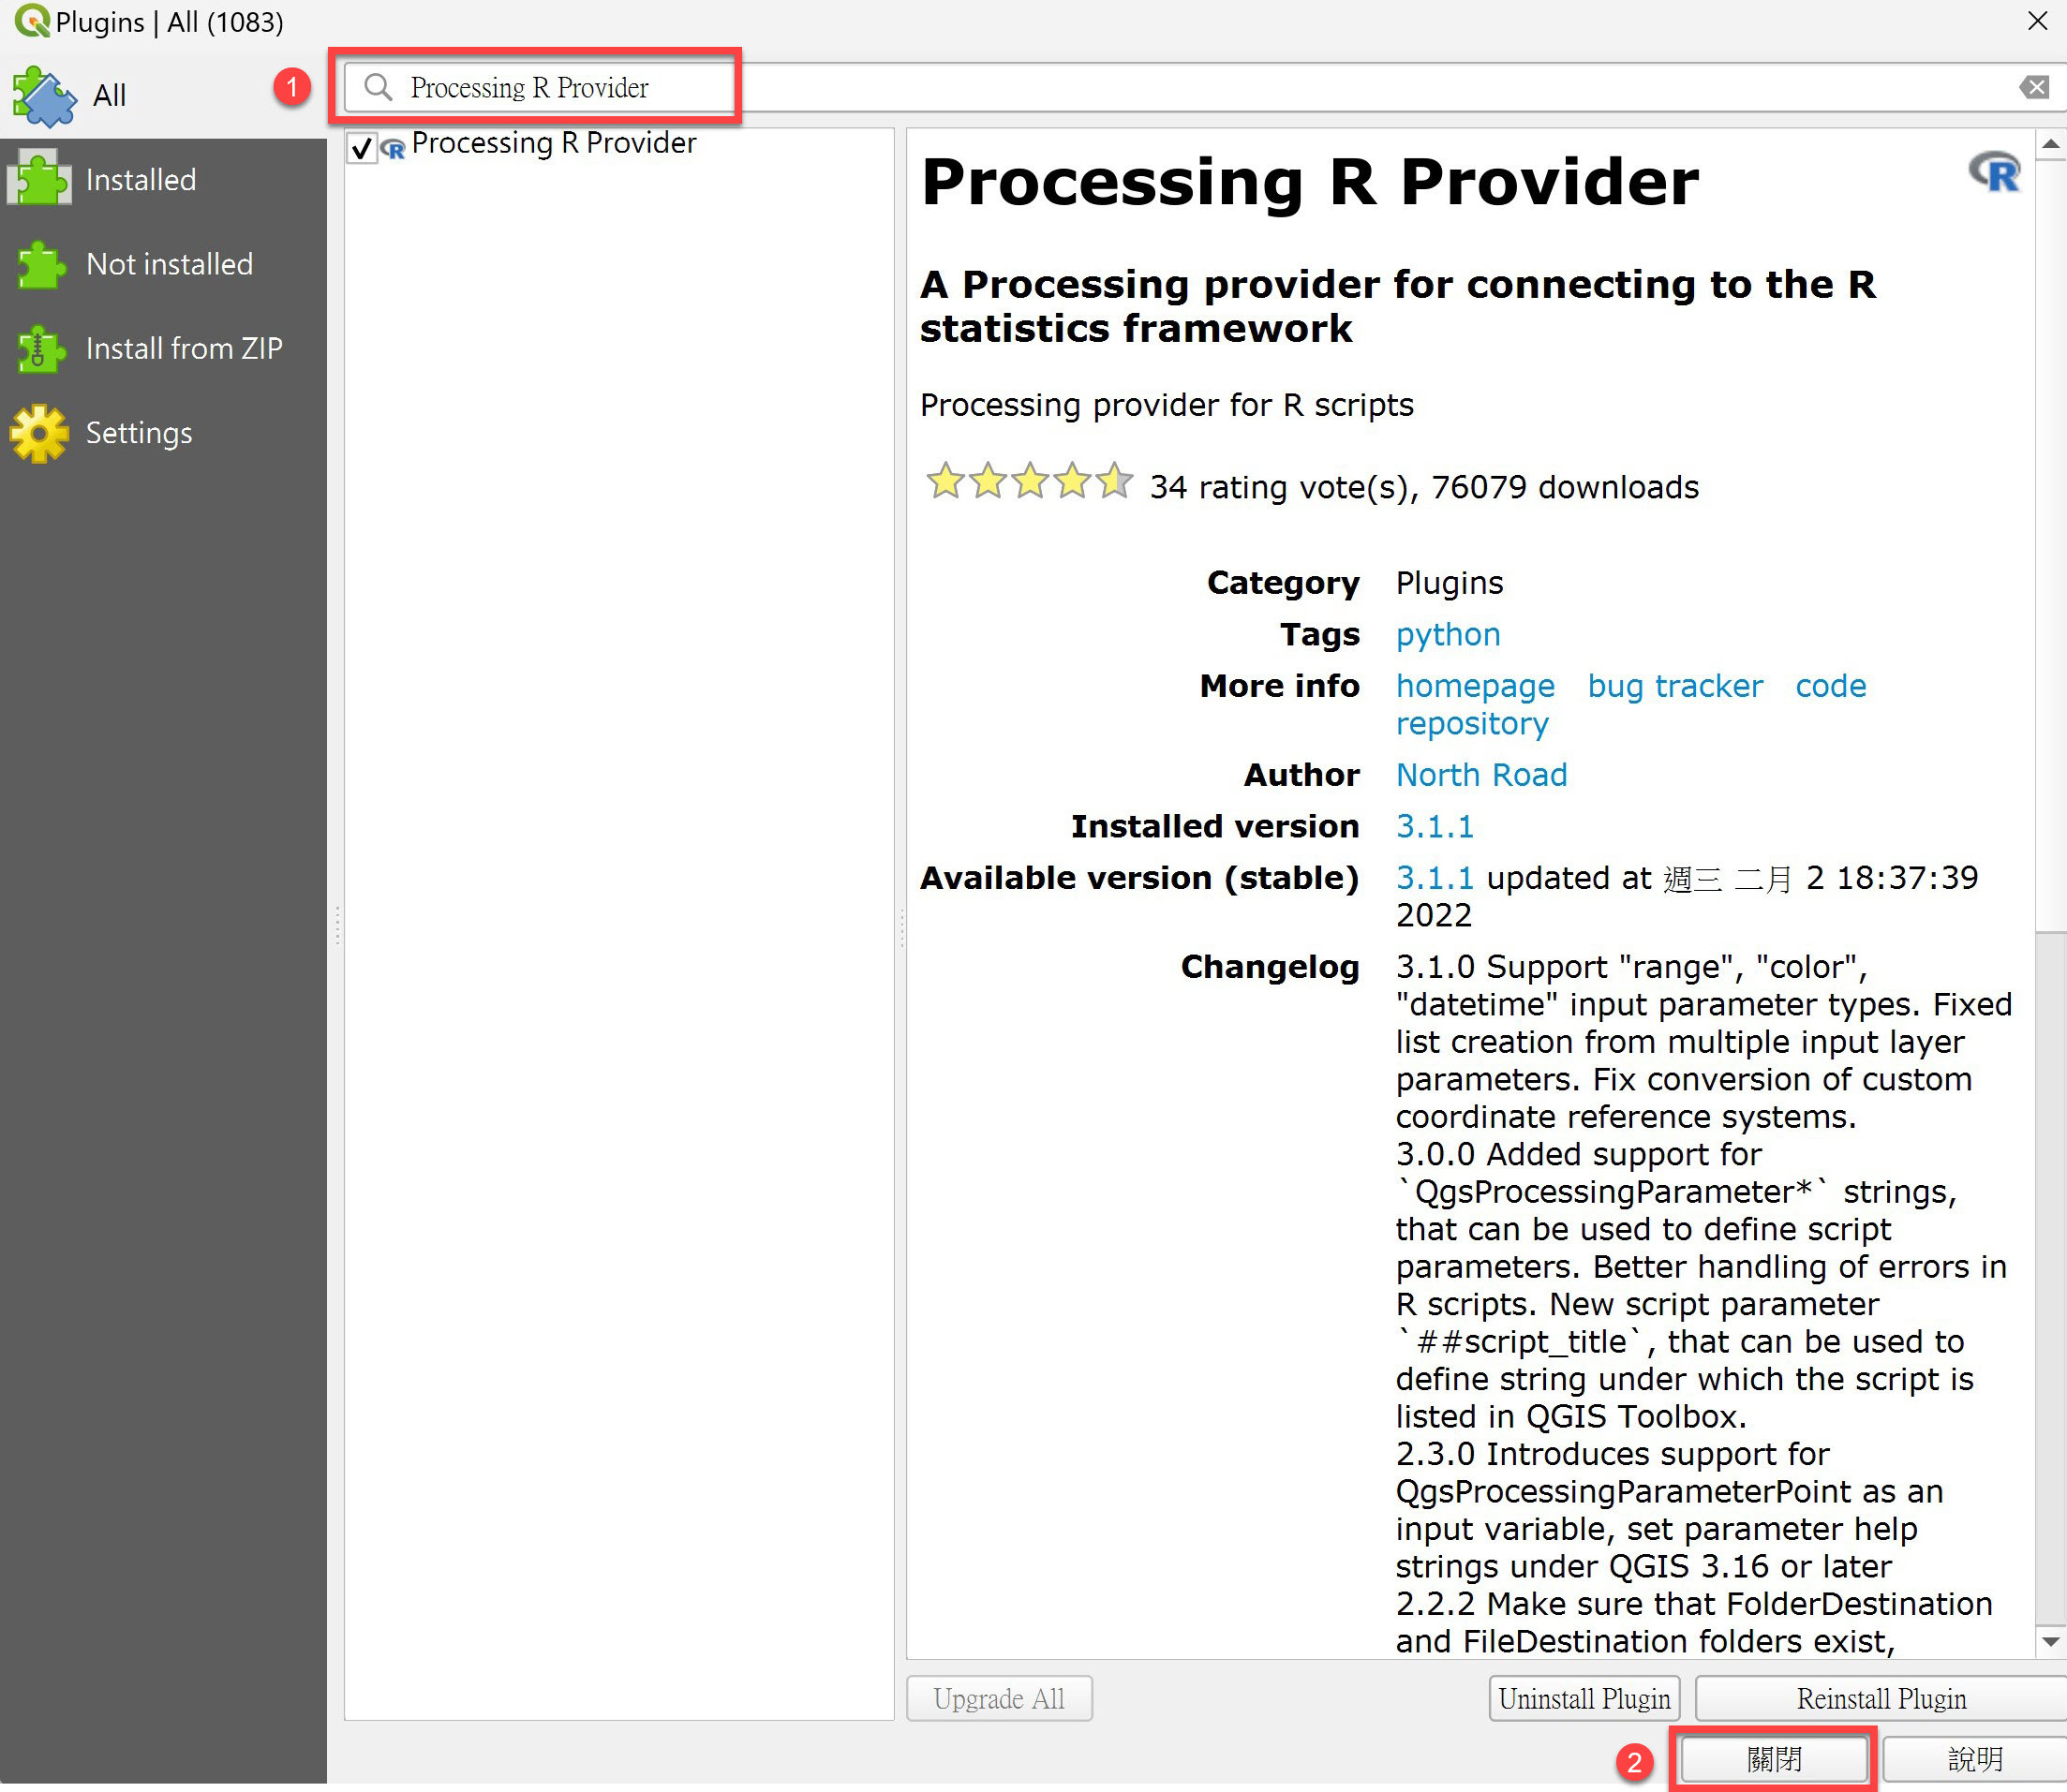
Search for Processing R Provider, then click Install Plugin › Close.
搜尋 Processing R Provider 後,點選 Install Plugin › Close(關閉)。
Step 4
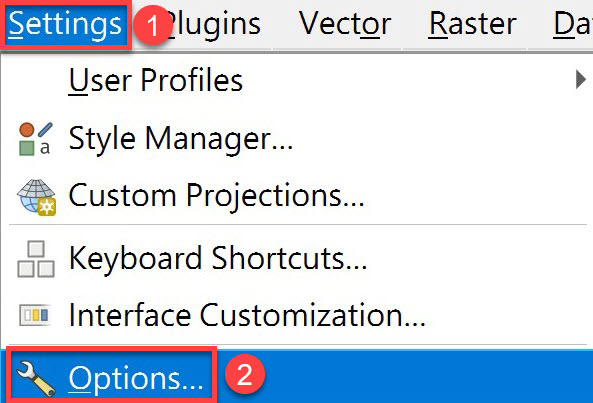
Restart QGIS, then click Settings › Options… in the top menu.
重新啟動 QGIS 後,於上方選單點選 Settings › Options…。
Step 5
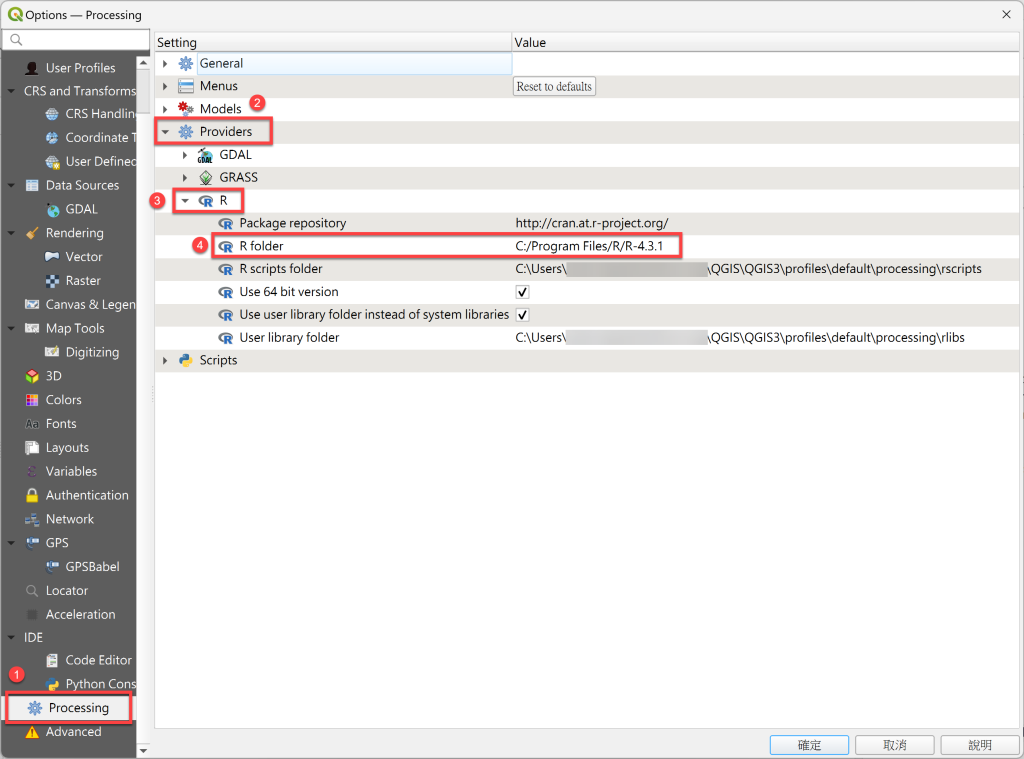
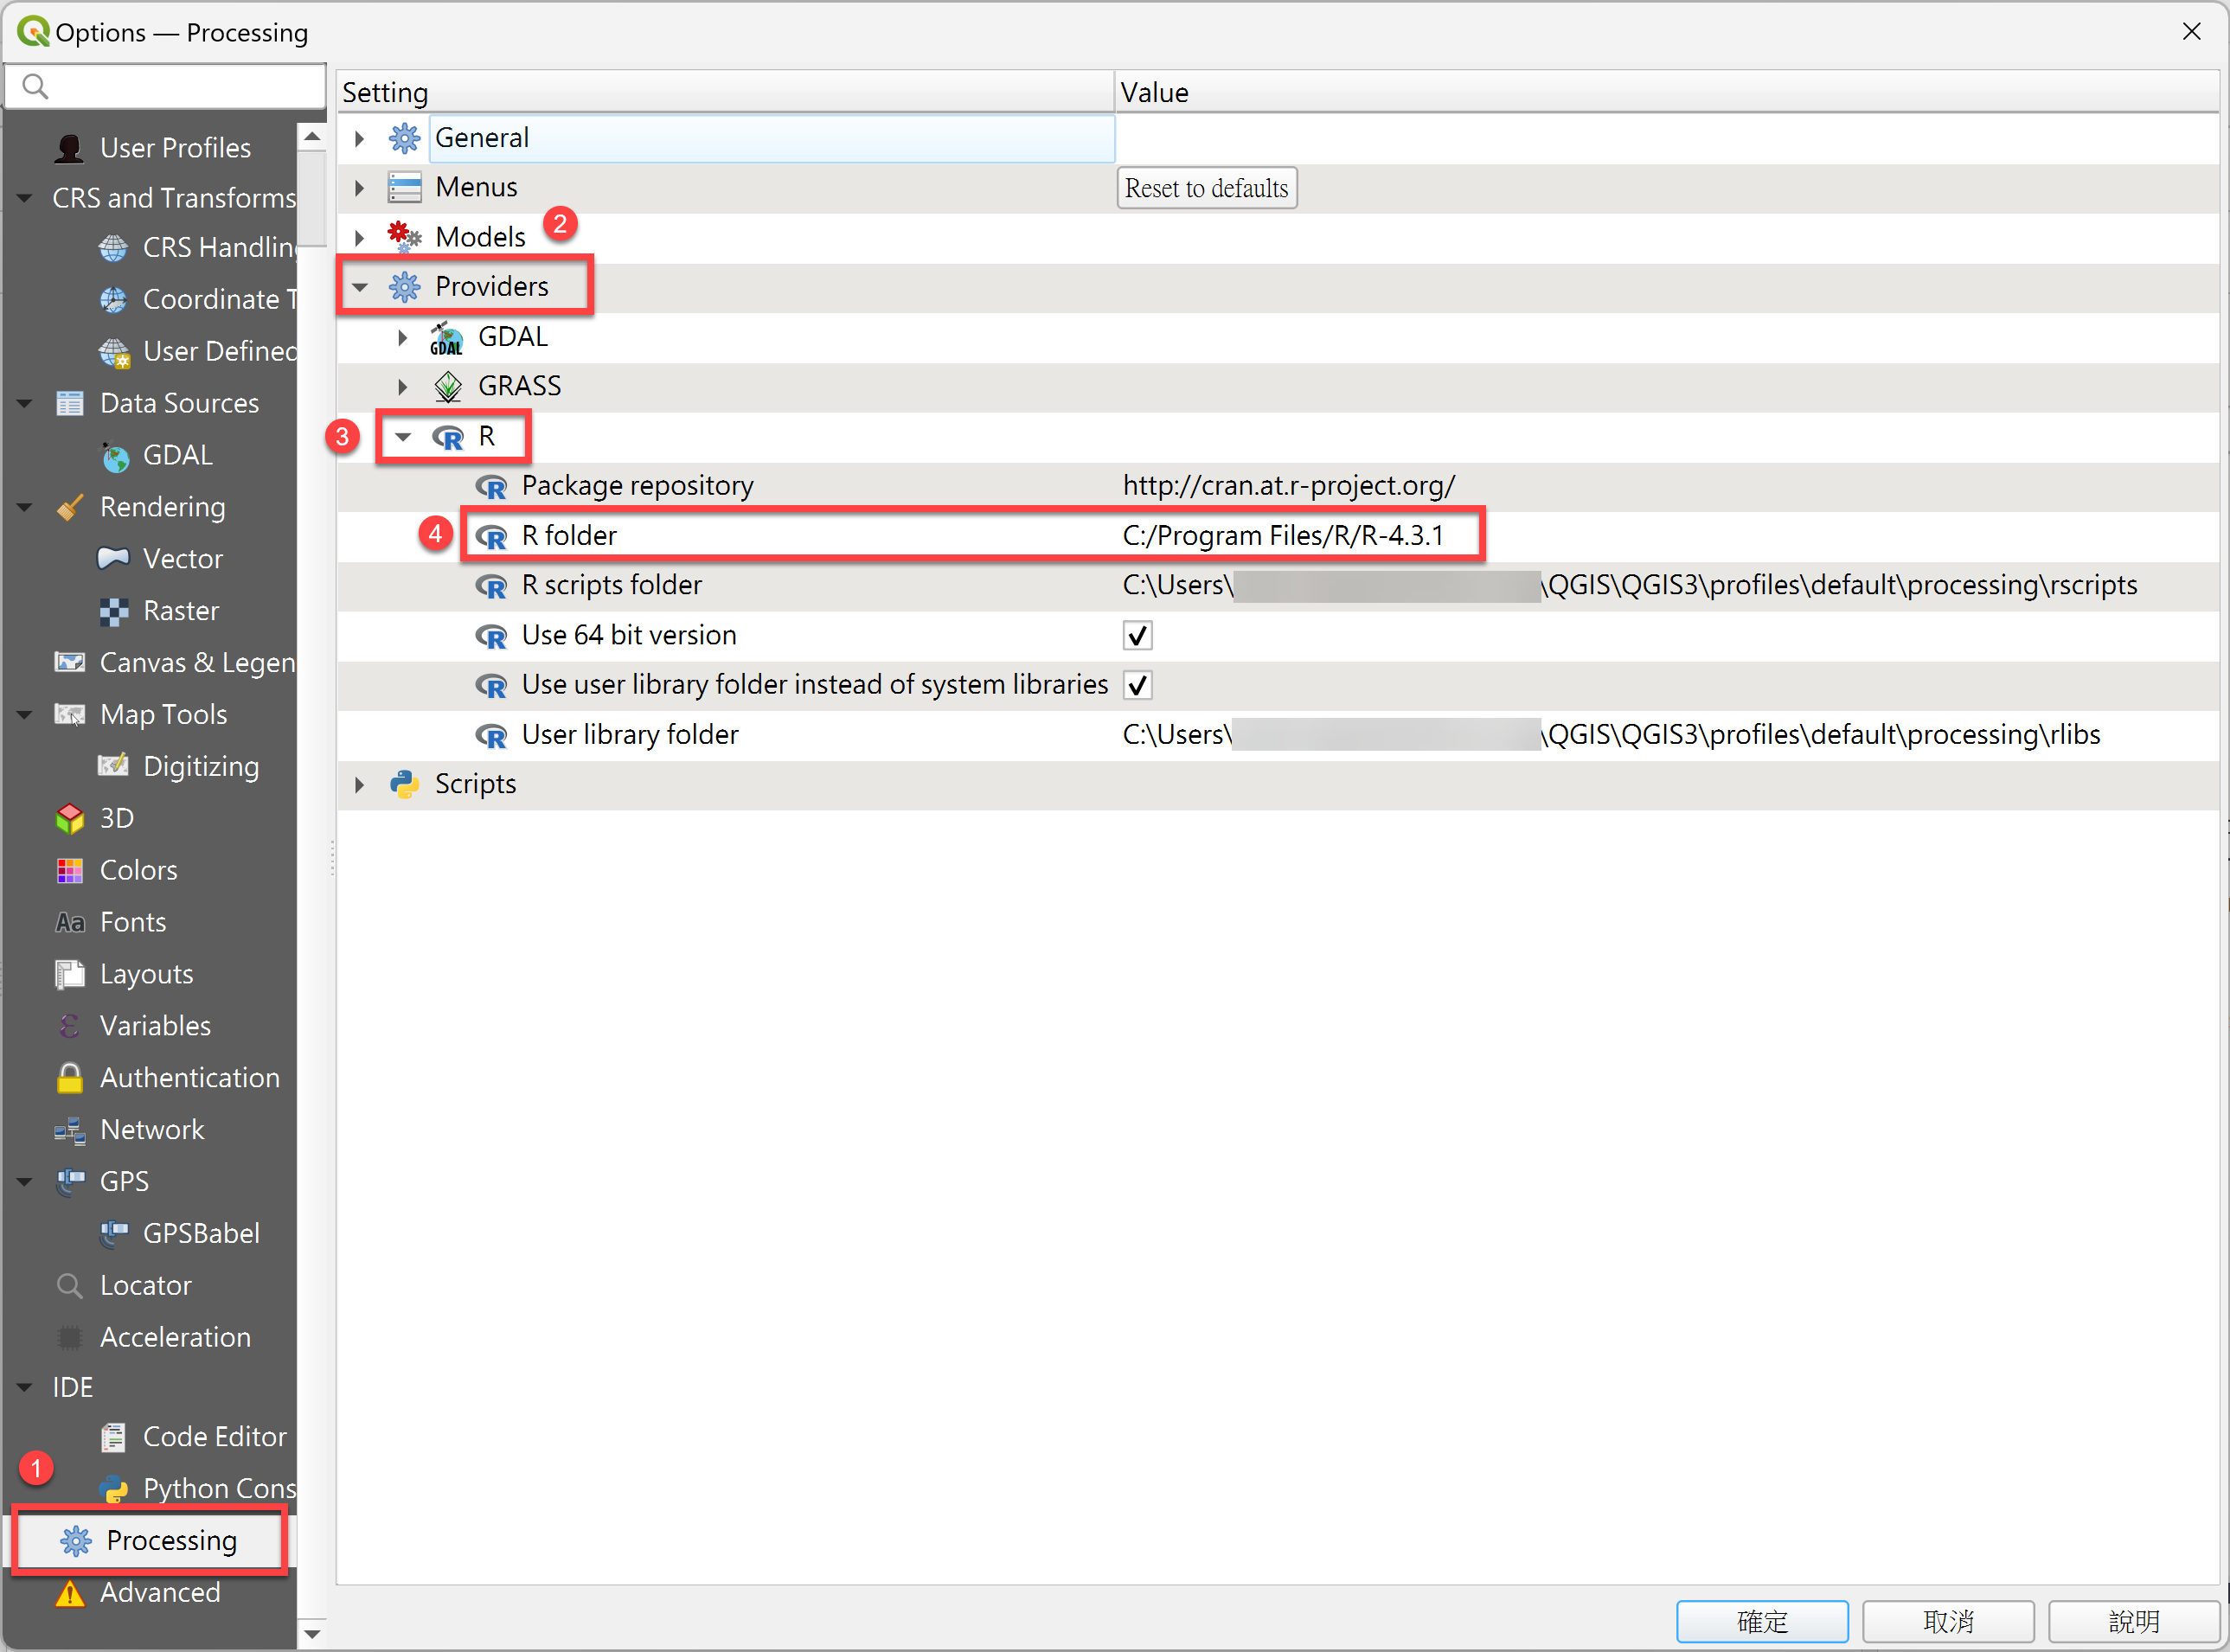
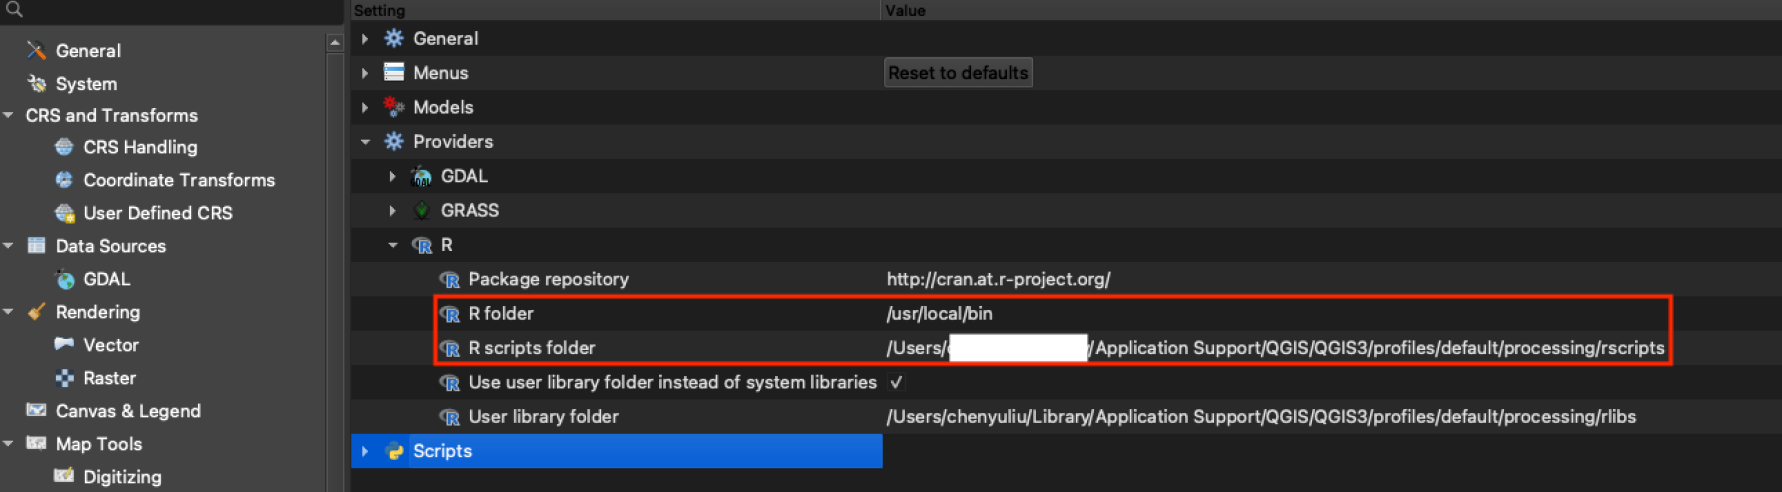
Click Processing › Providers › R and set the R folder path (e.g.
C:\Program Files\R\R-4.3.1; the actual path depends on your system and R version).點選 Processing › Providers › R,設定 R folder 路徑(例如:
C:\Program Files\R\R-4.3.1,實際路徑可能因系統、版本或安裝位置而異)。※ If the installed R is 64-bit, check Use 64 bit version.※ 若 R 安裝版本為 64 bit,須勾選 Use 64 bit version。
Windows settingsWindows 設定 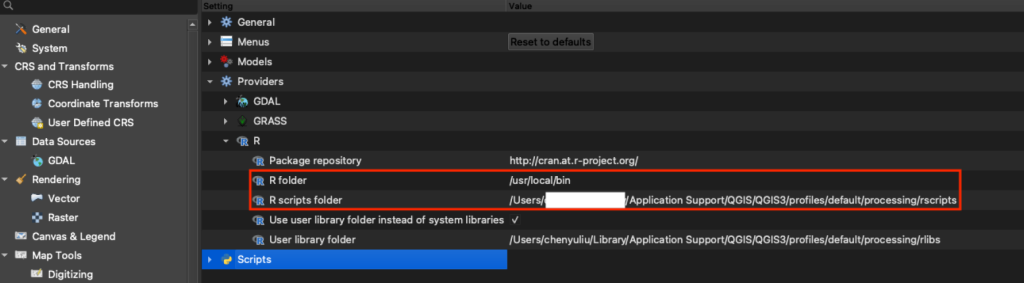
Mac settingsMac 設定 Step 6
Open the R scripts folder.
開啟 R scripts folder 資料夾。
※ This folder stores GWR and other R script files (it is located under the QGIS installation / profile directory).※ 此資料夾用於存放 GWR 或其他 R 程式檔案(路徑位於 QGIS 的安裝目錄下)。
Step 7
Unzip the program file and copy
gwr.rsxandgwr.helpinto the R scripts folder.解壓縮程式檔,將
gwr.rsx、gwr.help兩個檔案放入 R scripts folder 資料夾。
Step 8
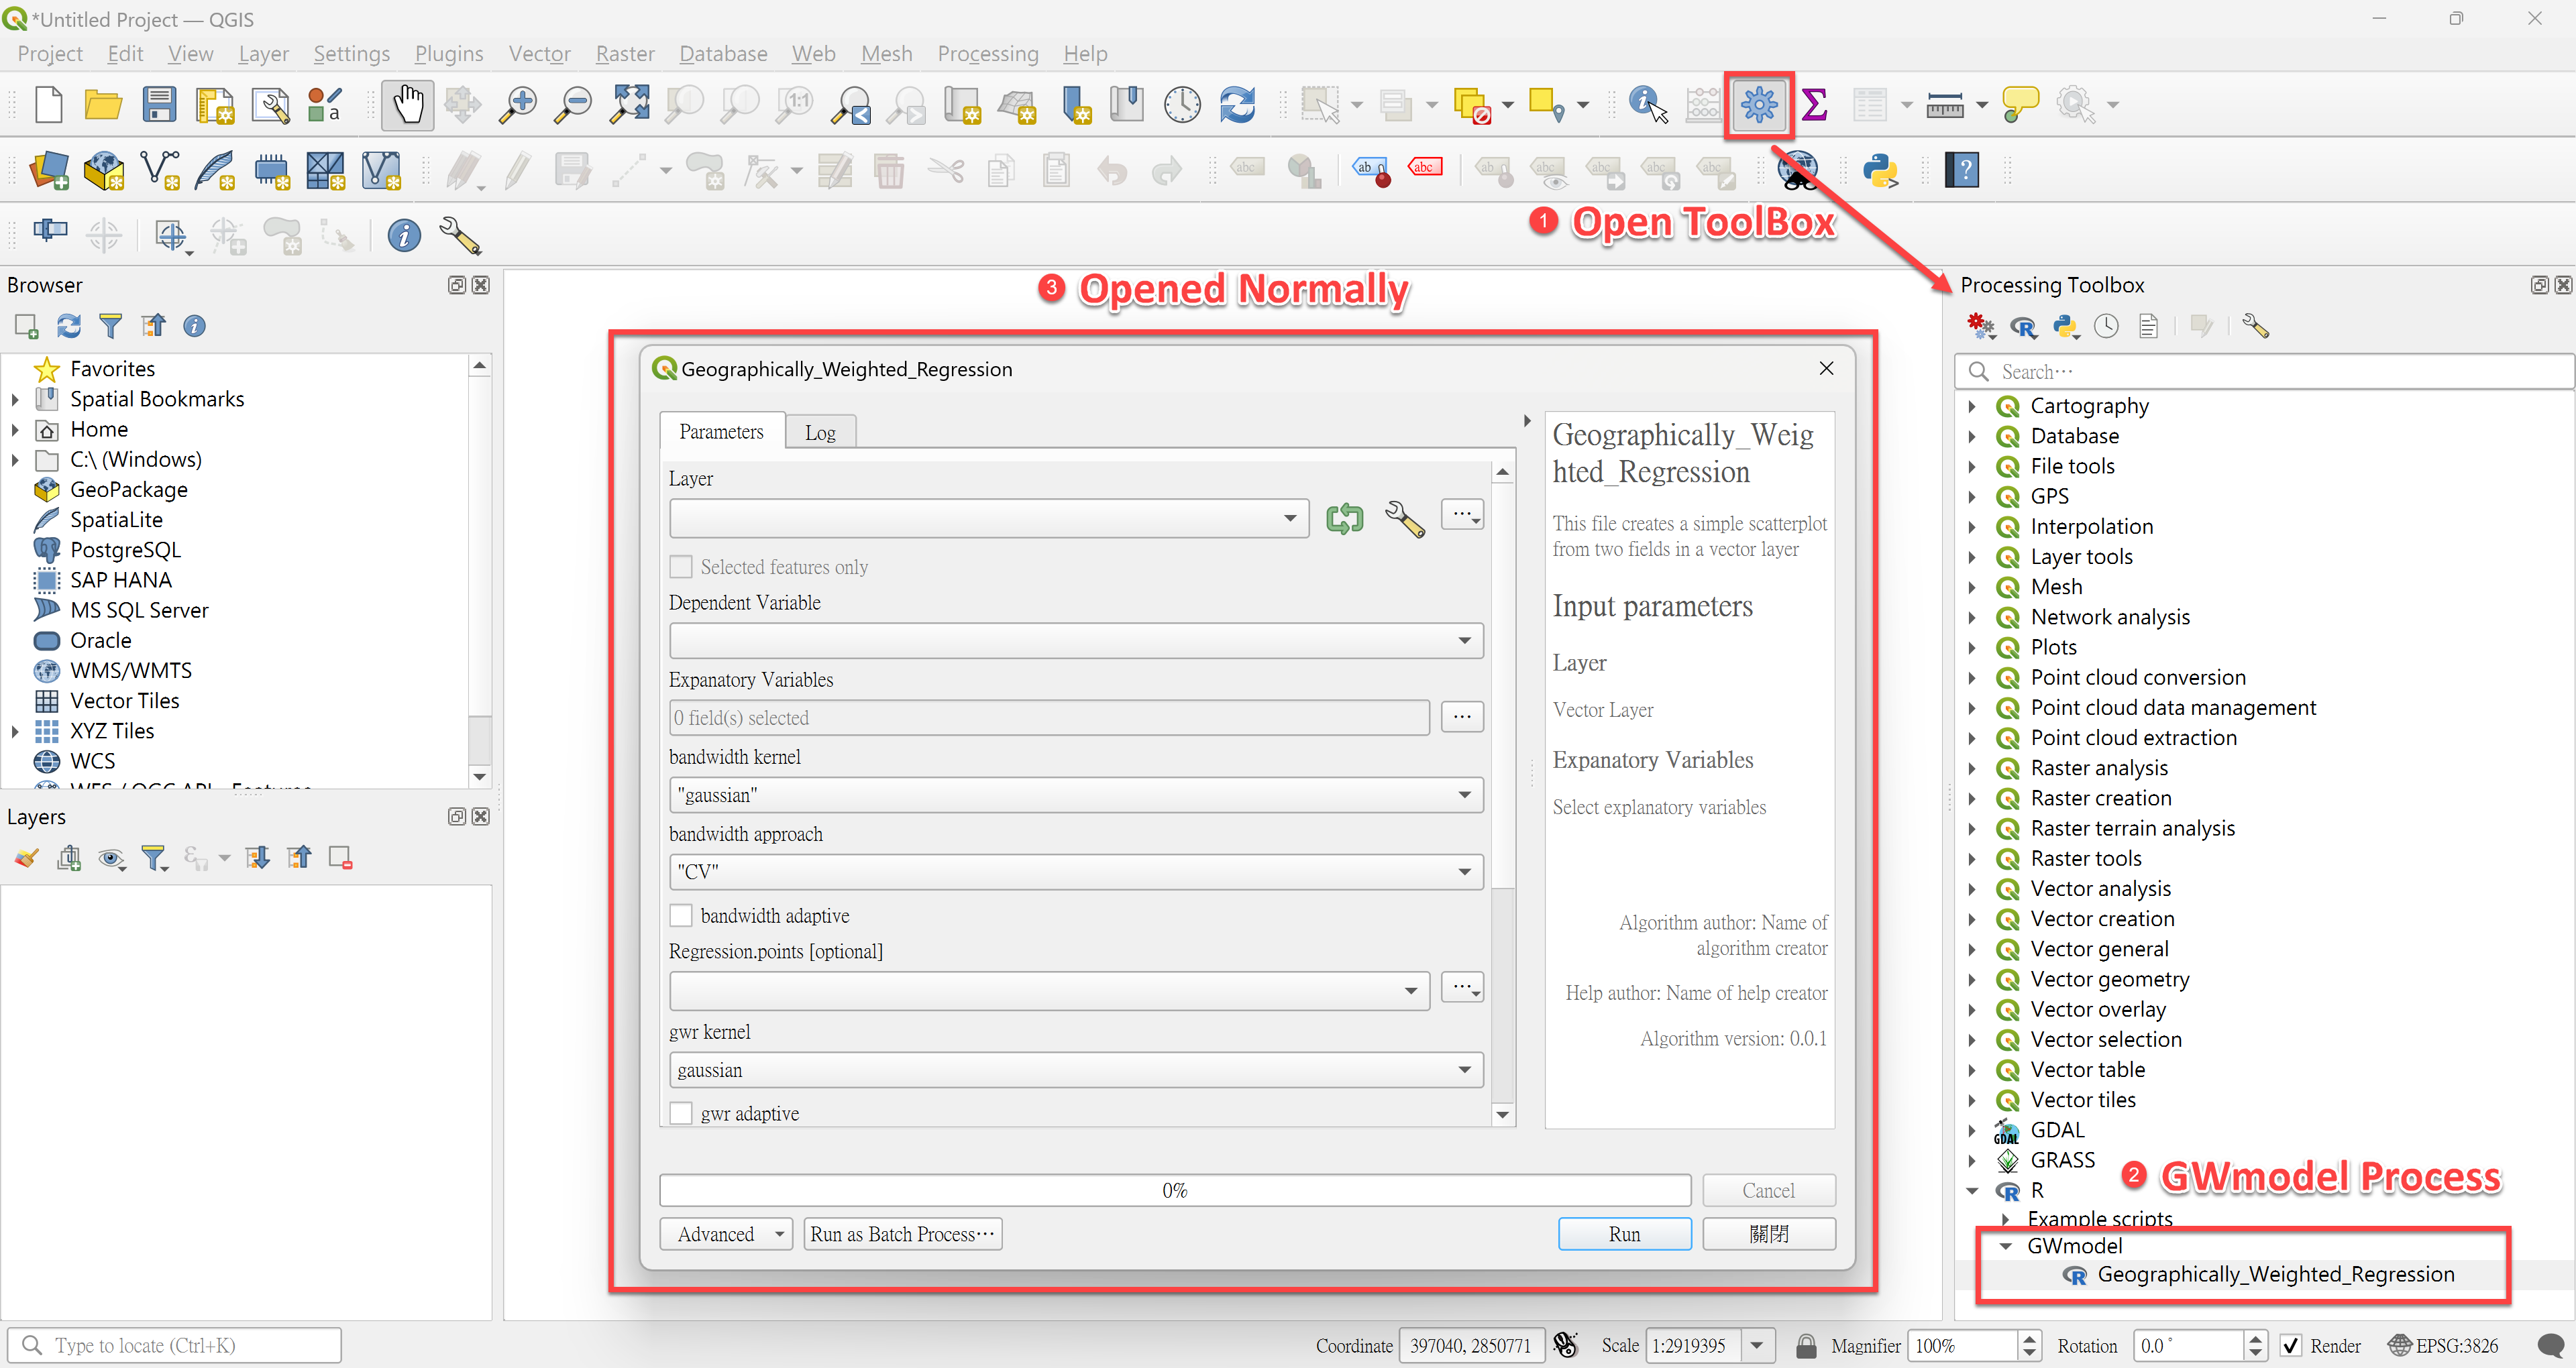
Restart QGIS and check in the Processing Toolbox that the R category and its GWmodel group are installed. If Geographical Weighted Regression appears under GWmodel and opens normally, the installation is complete.
重新啟動 QGIS,於 Processing Toolbox 確認是否成功出現 R 類別及其下的 GWmodel 資料夾。若在 GWmodel 類別中看到 Geographical Weighted Regression 程序並能正常開啟,即表示安裝完成。
※ If the tool appears but fails to open, check the R folder path set in Step 5.※ 若出現 Geographical Weighted Regression 程序但開啟時發生問題,可能是 Step 5 設定的 R folder 路徑有誤。
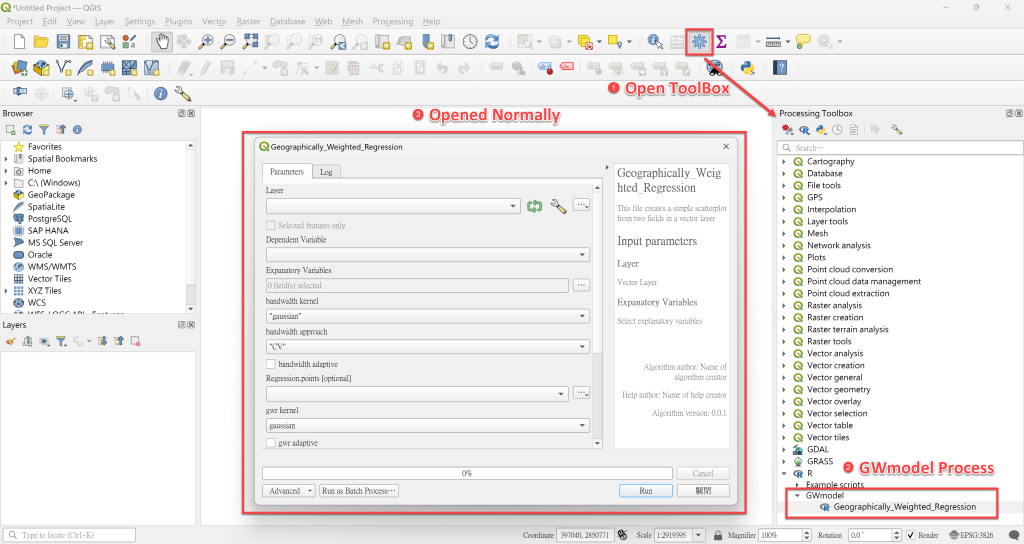
Example of a completed setup設定完成示範

Ⅲ. STEPSⅢ. 使用步驟
Run a GWR model執行 GWR 模型
Step 1Import data輸入資料
Import spatial point or polygon data into QGIS (the sample data can be used to try the tool).匯入空間點資料或面資料(可使用範例資料練習)。
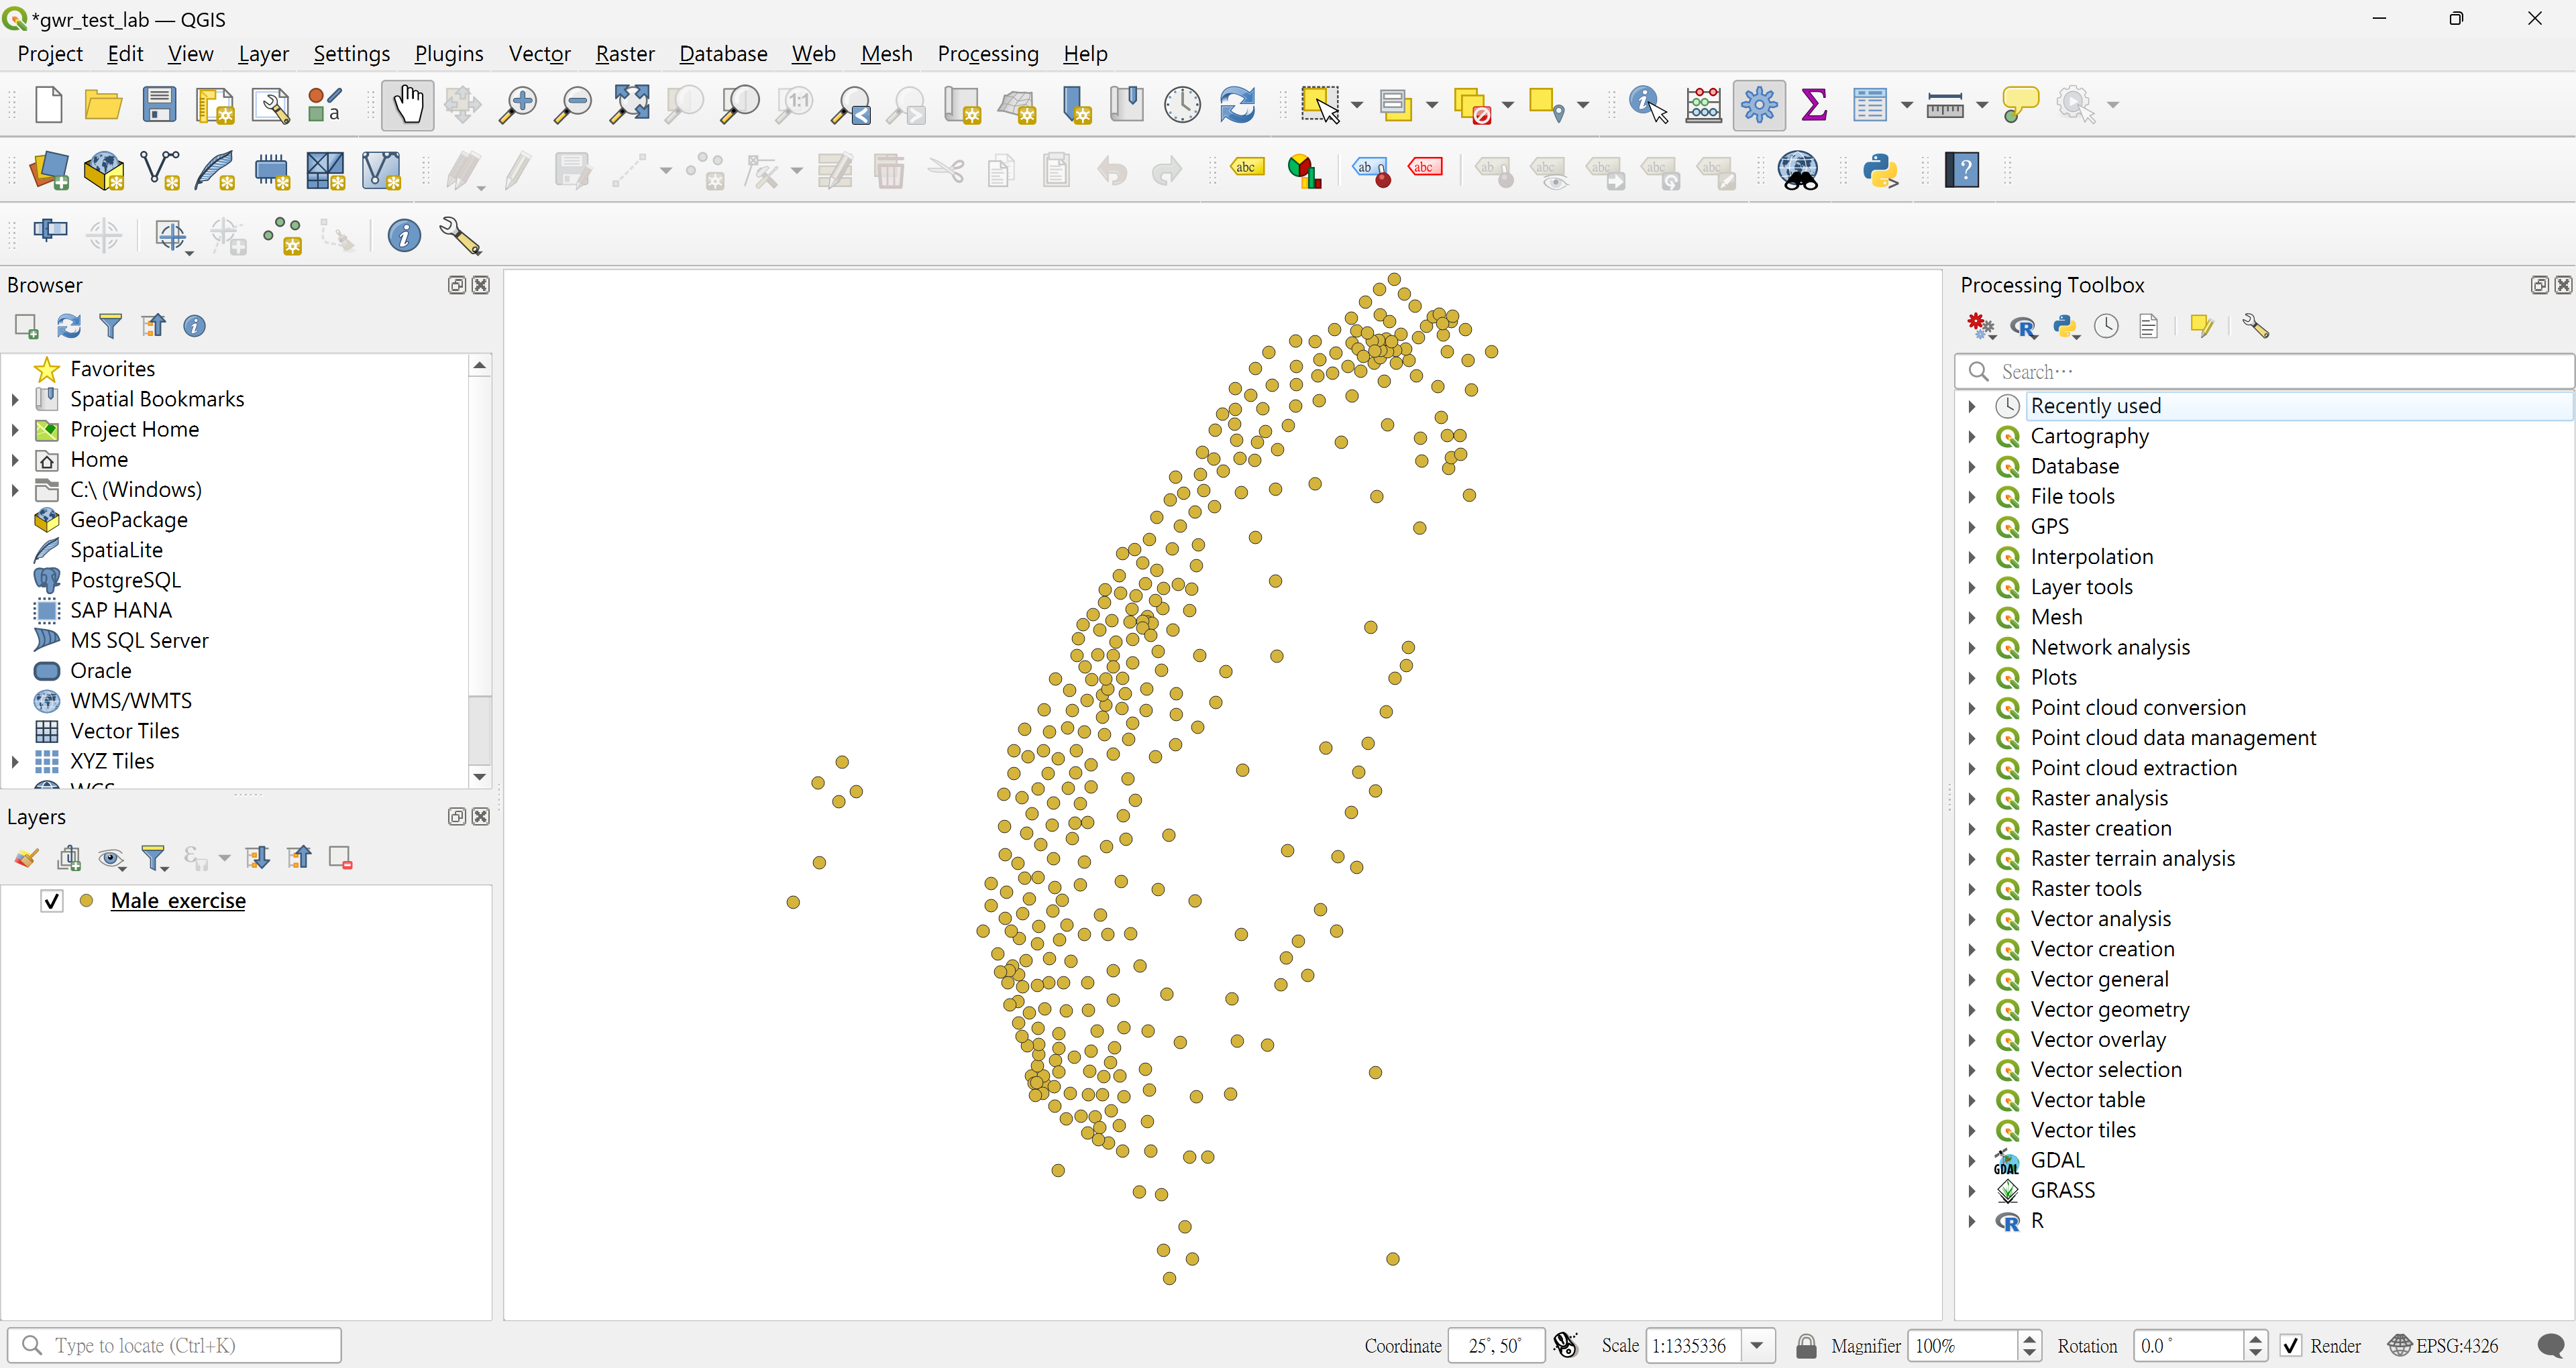
Open the Geographical Weighted Regression tool and choose the input data in Layer.匯入資料後,開啟 Geographical Weighted Regression 程序,於 Layer 選取輸入資料。

Step 2Select parameters選擇參數
This is the main user interface. Choose the inputs and parameters you need, and define the output folder.
此部分為使用者主要操作介面,可根據需求選擇相對應的參數與輸入,並定義輸出資料路徑。
| Parameter參數 | Type類型 | Description說明 |
|---|---|---|
| Dependent (response) variable反應變數 | Single choice單選 | Select one field as the response variable.由所有欄位中選擇一個作為反應變數。 |
| Explanatory variables解釋變數 | Multiple choice多選 | Select one or more fields as explanatory variables.由所有欄位中選擇一個或多個解釋變數。 |
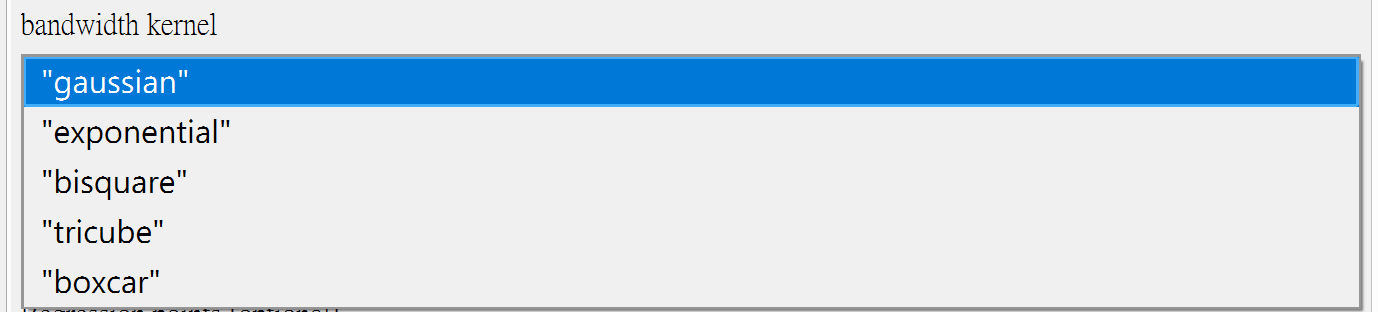
| Kernel function | List清單 | Gaussian, Exponential, Bisquare, Tricube, Boxcar |
| Approach | List清單 | Bandwidth selection criterion: CV, AIC, AICc, BIC頻寬選擇準則:CV、AIC、AICc、BIC |
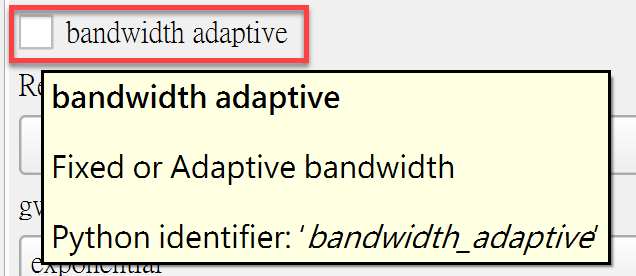
| Fixed / Adaptive | Option選項 | Fixed-distance or adaptive (nearest-neighbour) bandwidth.固定距離頻寬或適應性(最近鄰數)頻寬。 |
| Other parameters其他參數 | Optional選填 | All have default values; adjust as needed.皆有預設值,可依情況自行調整。 |
| Output folder path輸出資料路徑 | Required必填 | Folder where the results are written.指定結果輸出的資料夾。 |
● Dependent variable● 反應變數
A single-choice list of all fields; select the response variable you need.
所有變數的單選選單,可依需求選擇相應的反應變數。

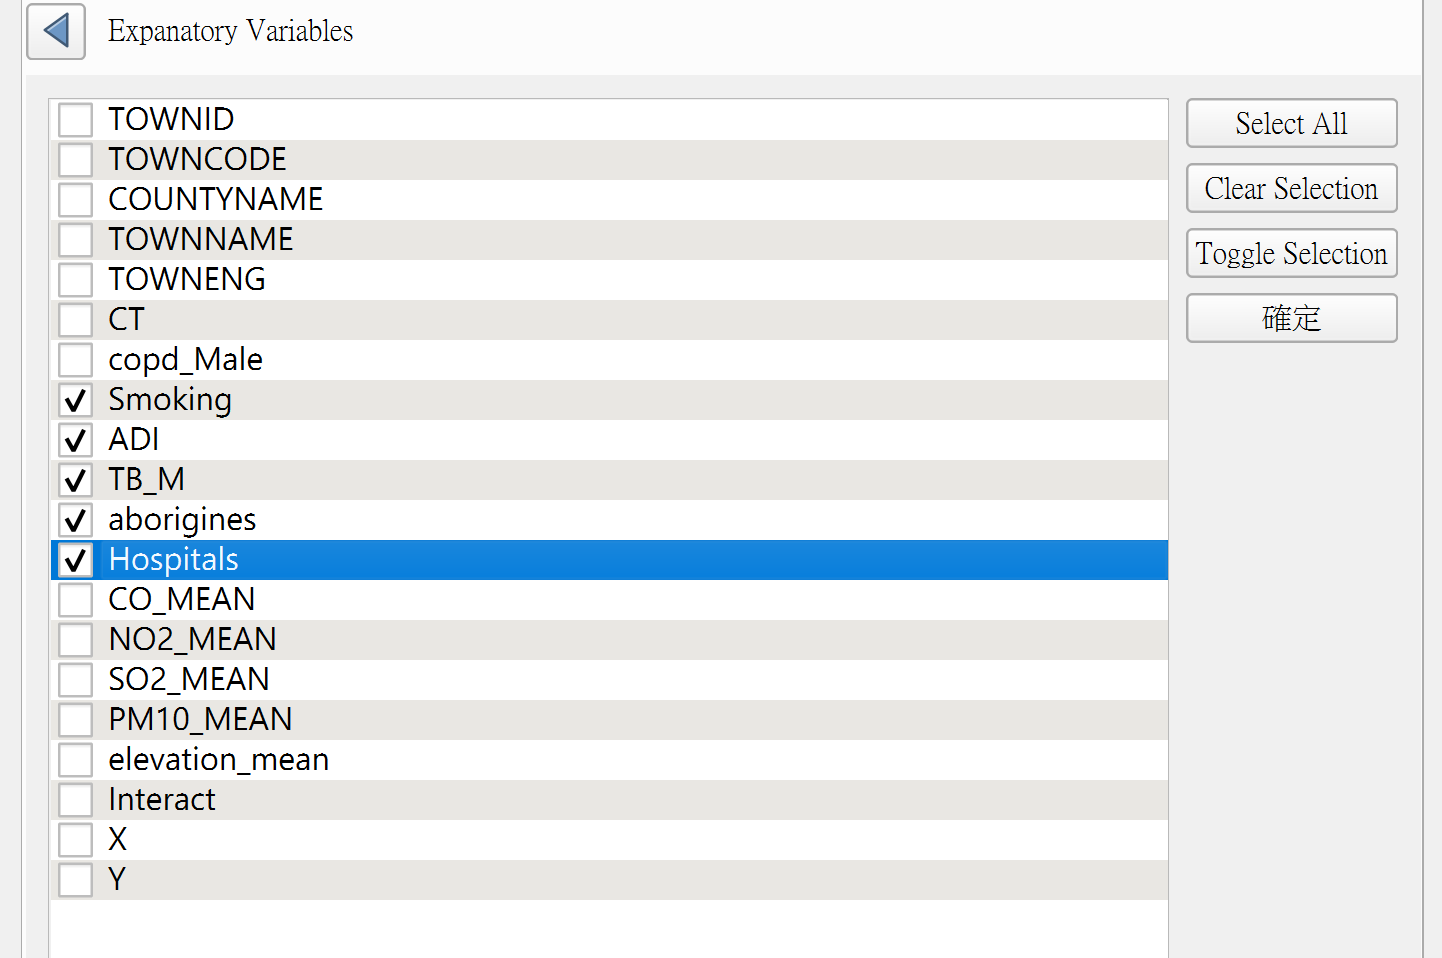
● Explanatory variables● 解釋變數
A multiple-choice list of all fields; select the explanatory variables you need.
所有變數的多選選單,可依需求選擇相應的解釋變數。
● Kernel, Approach and Fixed / Adaptive● Kernel、Approach 以及 Fixed / Adaptive 選擇
These settings are used to calculate the bandwidth and to fit the subsequent model.
選擇計算 Bandwidth 的參數及後續模型的參數。
○ Kernel function list – Gaussian, Exponential, Bisquare, Tricube, Boxcar○ Kernel Function 清單 – Gaussian、Exponential、Bisquare、Tricube、Boxcar
○ Approach list – CV, AIC, AICc, BIC○ GWR Approach 清單 – CV、AIC、AICc、BIC

○ Fixed or adaptive bandwidth○ Fixed 或 Adaptive bandwidth
● Other parameters● 其他參數選擇
All have default values and can be adjusted according to your situation.
皆有預設值,可根據情況自行調整。

● Output folder path● 輸出資料路徑(Folder Path)
An output folder must be specified.
需指定資料輸出路徑。

Step 3Output results輸出結果
● Log output● 文檔輸出
While the tool runs, QGIS shows two main pieces of output:
在 QGIS 執行程序過程中,主要輸出兩部份資料:
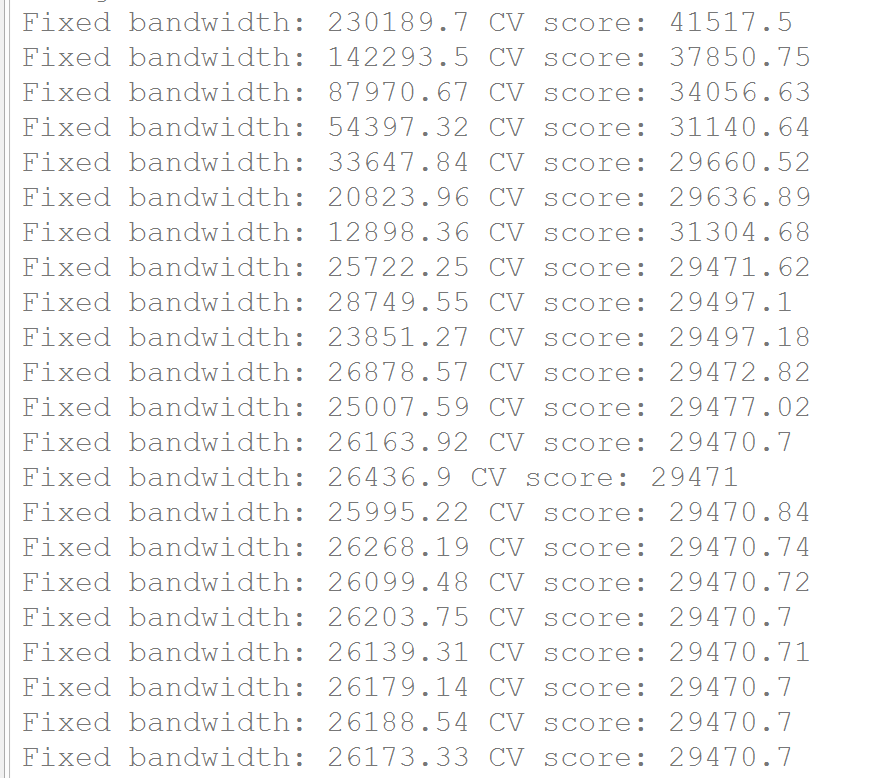
- Scores for different bandwidths – with a fixed bandwidth selected by CV score, the log lists each candidate bandwidth and its score (left figure).不同 Bandwidth 的分數:由於參數選擇 Fixed 的 Bandwidth 並以 CV 分數進行選擇,輸出結果會列出不同的 Bandwidth 及其對應分數(見左圖)。
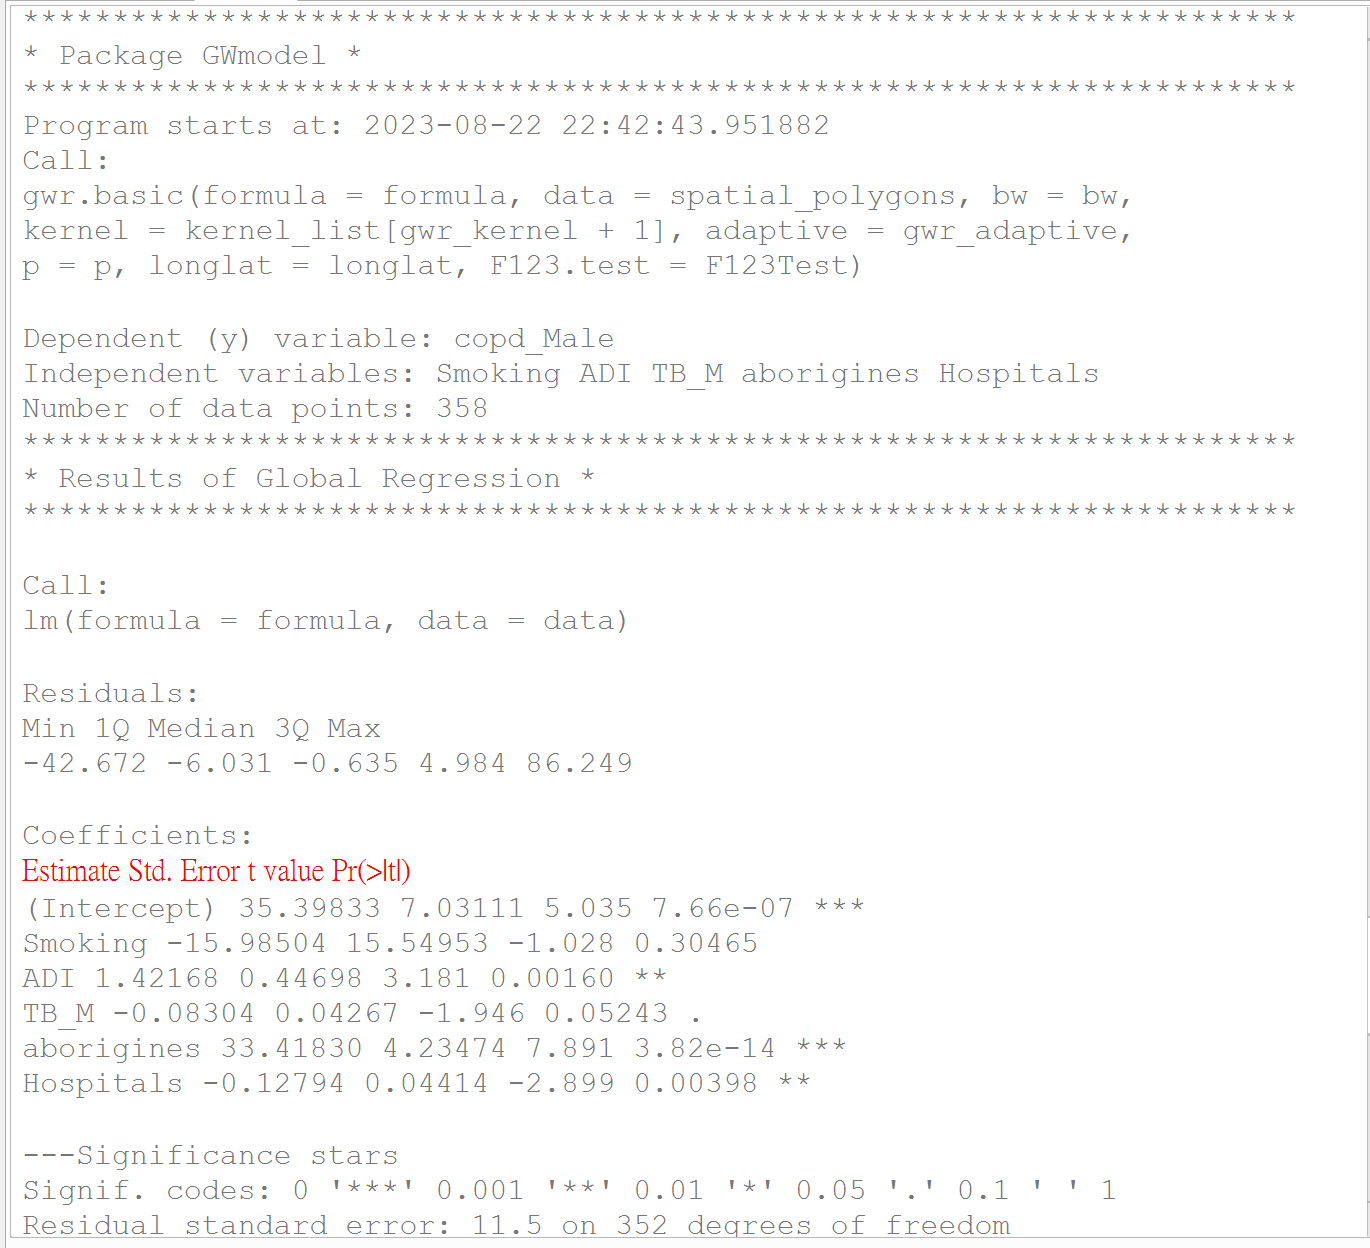
- Model results – basic information about the fitted model (right figure). The same content is also saved as a text file in the output folder.模型的結果:可看到模型的基本資訊(見右圖),此內容會同時輸出為一份文檔至使用者設定的輸出路徑。
● Data output● 資料輸出
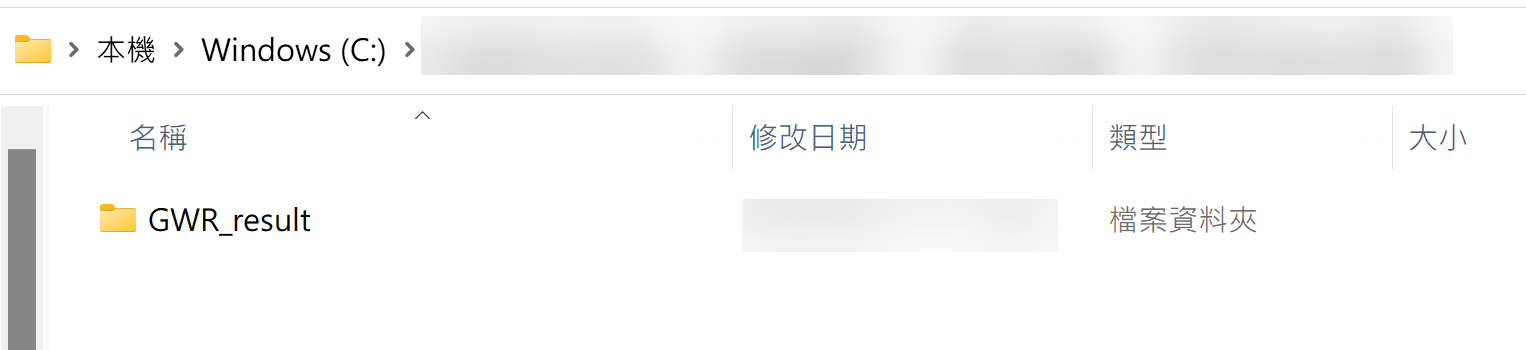
When the tool finishes, a GWR_result folder is created in the output path (left figure). It contains two parts:
執行程序完畢後,會在使用者指定的路徑中建立 GWR_result 資料夾(見左圖),內容共有兩大部分:
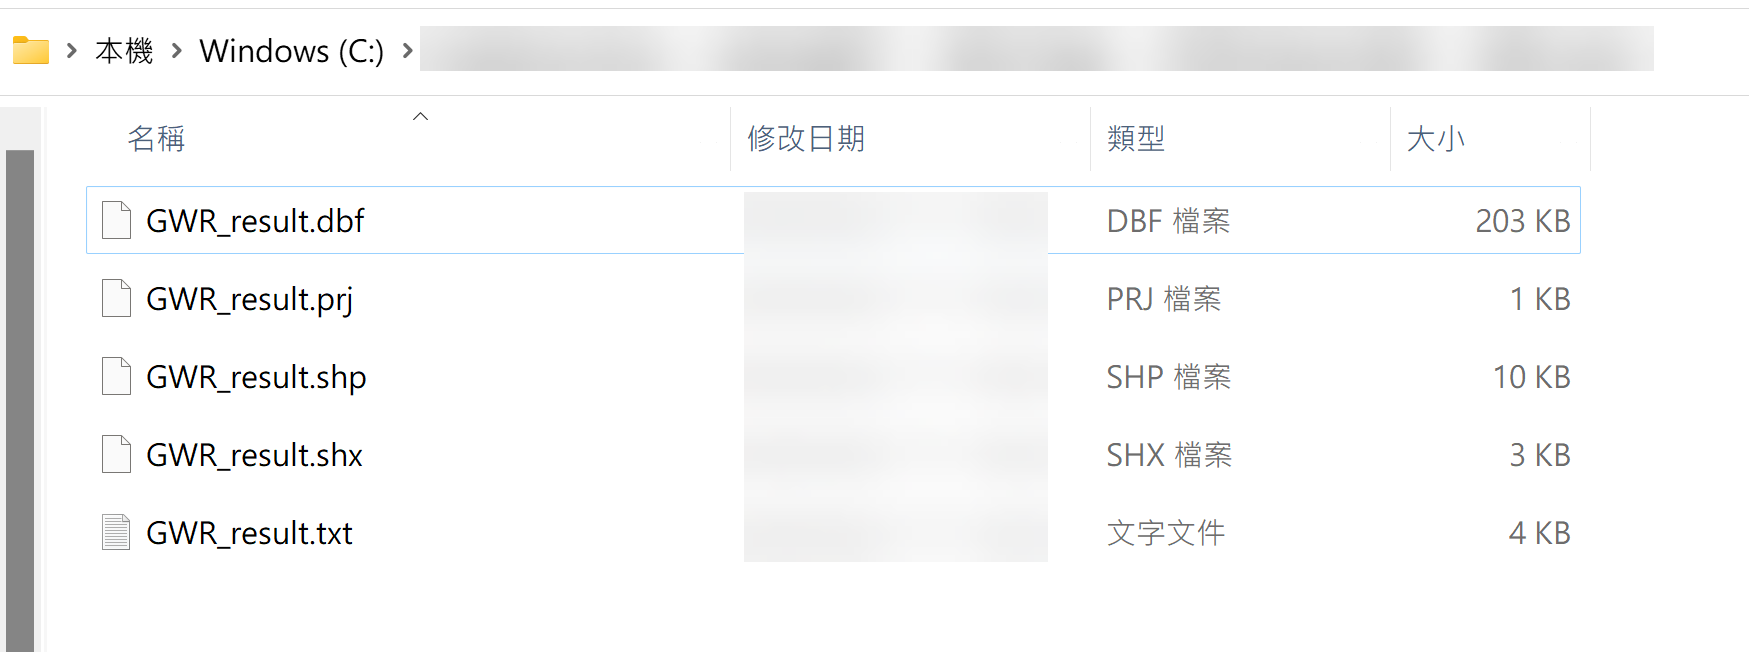
GWR_result.txt– the model information document (right figure).GWR_result.txt:模型的資訊文檔(見右圖)。- Model output shapefile –
GWR_result.shp,.shx,.dbfand.prj. LoadGWR_result.shpinto QGIS to use it. After the tool finishes, QGIS also adds an Output layer with the same content.模型輸出結果 Shapefile:包含GWR_result.shp、.shx、.dbf與.prj四個檔案,可將GWR_result.shp匯入 QGIS 使用。程序完成後 QGIS 也會新增一個 Output 圖層,內容與 GWR_result.shp 相同,皆為模型輸出結果。
Local coefficients and local fit statistics should be interpreted with attention to bandwidth selection, multicollinearity, sample size, spatial scale, and the assumptions of the model. GWR is an exploratory modelling approach and does not by itself establish causation.
References參考資料
For more information, see the following:
想了解更多,可參考以下資料:
- Chan, T. C., Chiang, P. H., Su, M. D., Wang, H. W., & Liu, M. S. Y. (2014). Geographic disparity in chronic obstructive pulmonary disease (COPD) mortality rates among the Taiwan population. PLoS ONE, 9(5), e98170.
- Fotheringham, A. S., Crespo, R., & Yao, J. (2015). Geographical and temporal weighted regression (GTWR). Geographical Analysis, 47(4), 431–452.
- Nugroho, W. H., & Sumarminingsih, E. (2021, March). Geographically and Temporally Weighted Regression Model with Gaussian Kernel Weighted Function and Bisquare Kernel Weighted Function. In IOP Conference Series: Materials Science and Engineering (Vol. 1115, No. 1, p. 012063). IOP Publishing.
- Wu, B., Li, R., & Huang, B. (2014). A geographically and temporally weighted autoregressive model with application to housing prices. International Journal of Geographical Information Science, 28(5), 1186–1204.